octopusgames
Research/4D Midstream Digital Twin
RESEARCH · GENERATION 4 · STATE(x, t)
4D Midstream Digital Twin
A spatiotemporal digital-twin demonstration of a fictional 255 km products corridor. Pressure, flow, temperature and inventory evolve through space and time; synthetic sensors observe the system; the twin's expectation, residuals, evidence-based risk, localisation, prediction and simulation-only counterfactual futures are all derived from one deterministic trajectory. Open the live twin →
134state samples along 255 km + 30 km + 40 km of line
47synthetic sensors with GOOD / SUSPECT / FAILED / STALE quality
43 / 43vitest tests incl. 12 deterministic golden scenarios
42 / 42headless browser acceptance checks
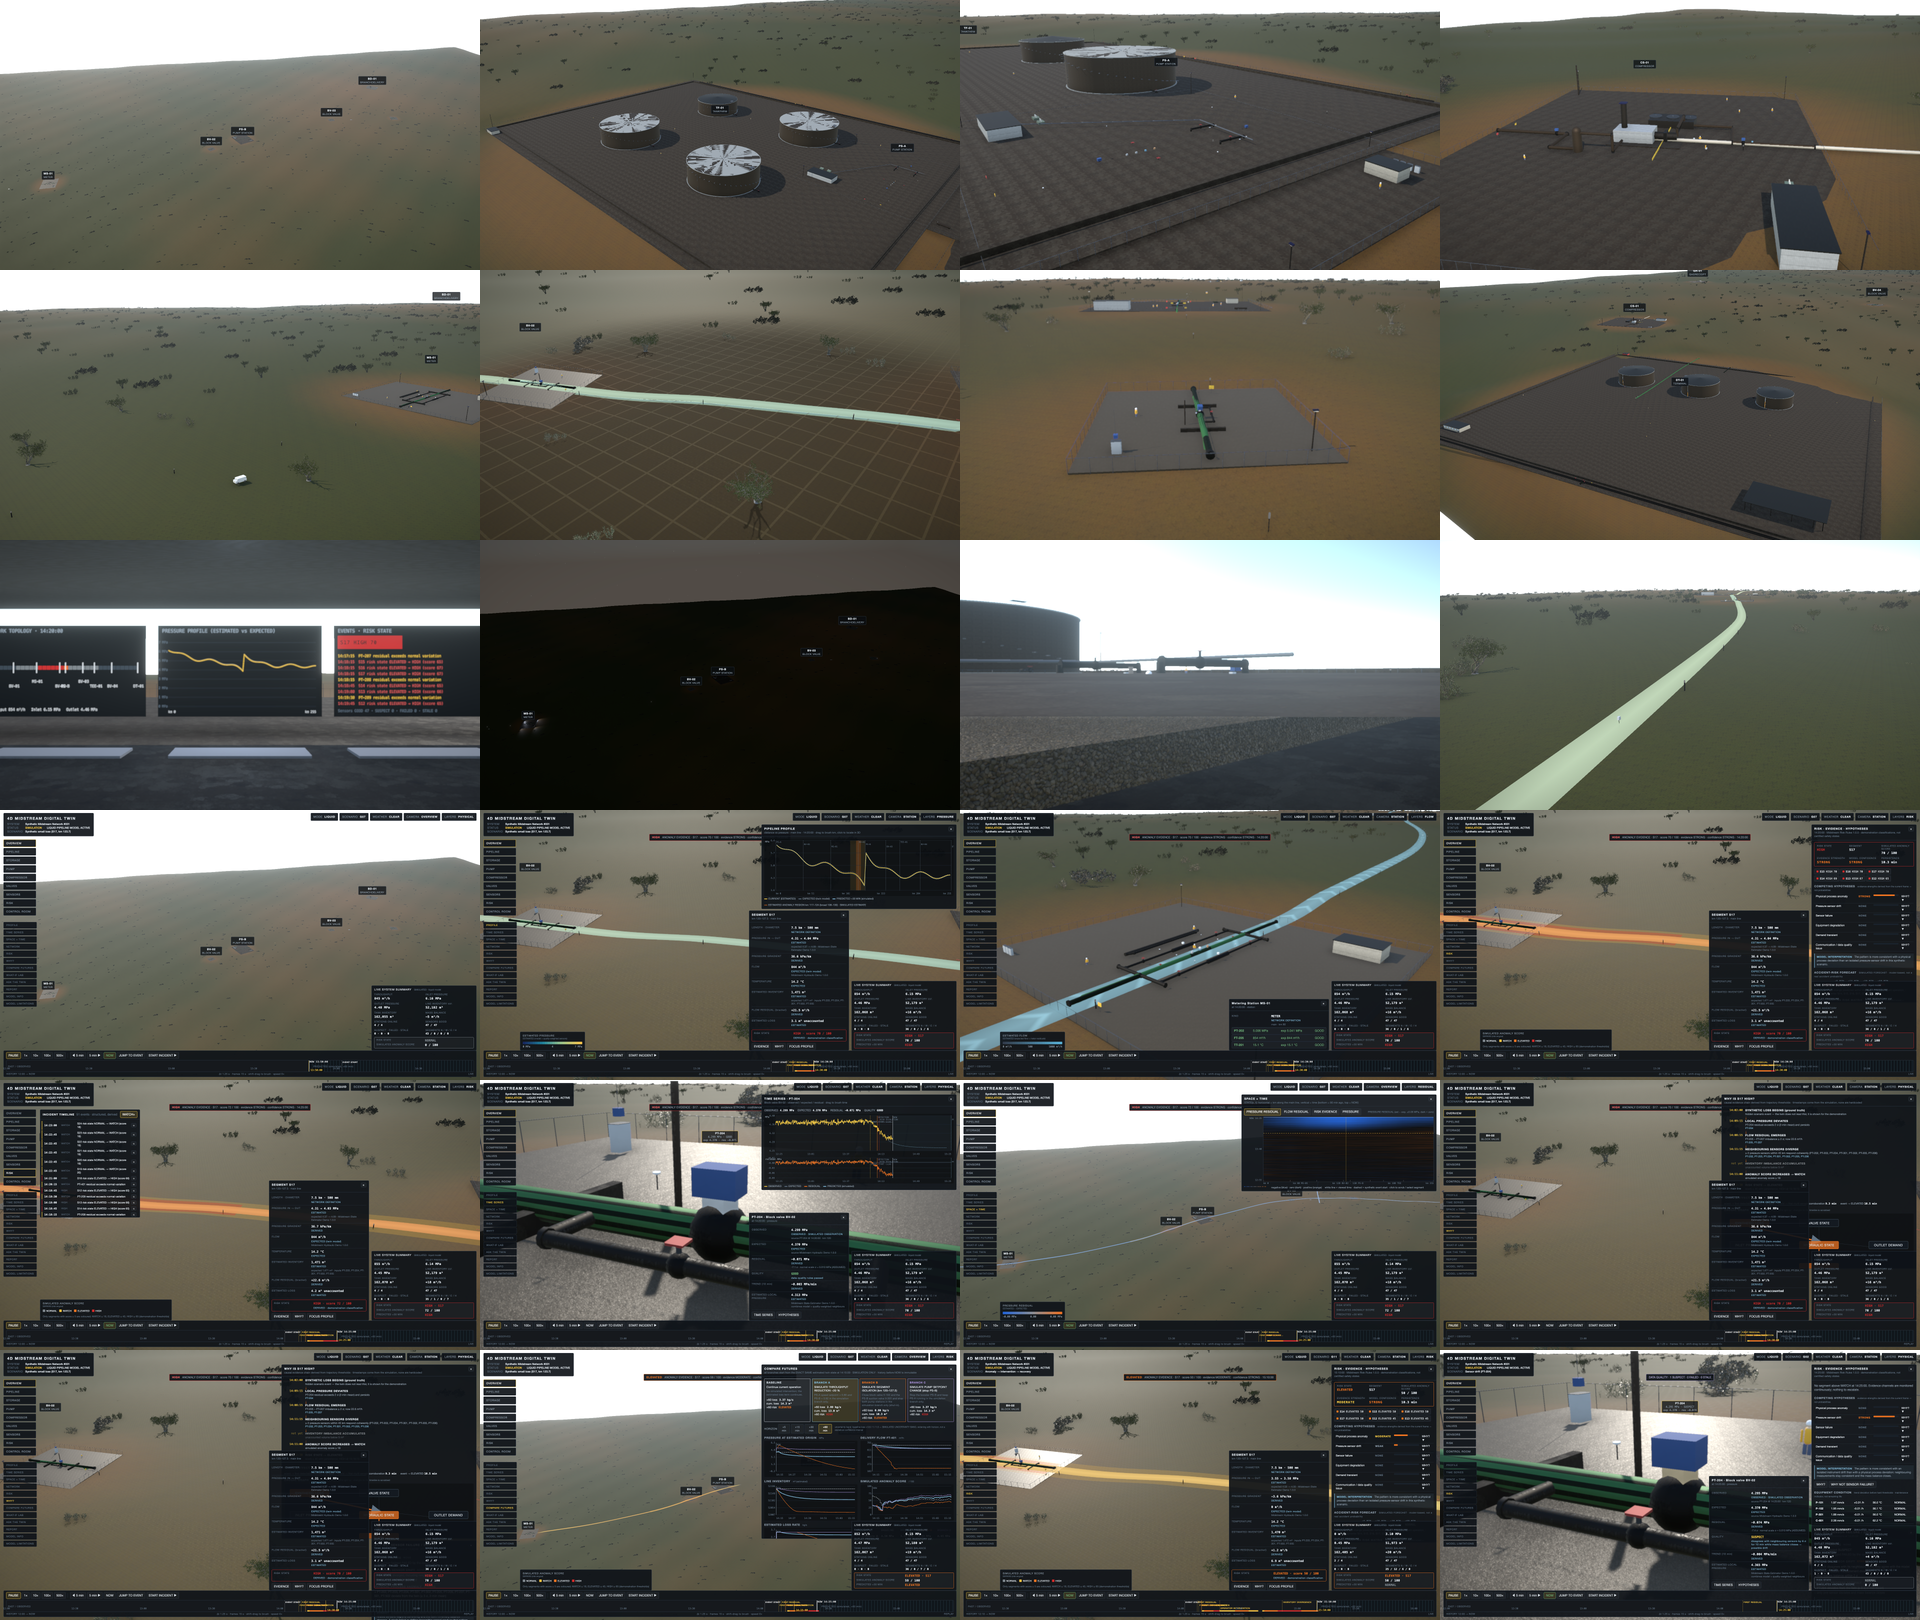
24visual acceptance captures
109–211 fpsat 1920×1200; 58–110 fps at Retina 3840×2400, no frame over 33 ms
What it demonstrates
- Observed ≠ expected ≠ estimated. Every sensor record carries observed value, twin expectation, residual, normal residual scale and a data-quality flag; a state estimator blends model and quality-weighted measurements.
- Evidence, not alarms. Seven evidence channels (pressure residual, flow imbalance, unaccounted volume, persistence, neighbour corroboration, rate of change, sensor quality) form a simulated anomaly score; WATCH → ELEVATED → HIGH evolves over minutes. A synthetic loss is distinguished from pressure-sensor drift by competing hypotheses with their supporting and contradicting facts.
- Space × time. A heatmap of km against time shows the disturbance spreading from its origin; the pipeline profile, 3-D overlays and causal chain read the same frames.
- Counterfactual futures. From any moment, four simulation-only branches (continue, reduce throughput, isolate, change pump) start from the identical estimated state; what changed, when and where is derived from trajectory differences. Nothing is executed on any system.
- Honesty. The hydraulic model is a simplified 1-D transient demonstration; the score is not a probability; localisation is an estimated region; limitations are a first-class panel, not fine print.
Reports
Engineering reportArchitecture, simulation model and simplifications, network, state variables and provenance, sensors, estimation, anomaly and risk logic, prediction, counterfactuals, causal analysis, 3-D architecture, performance, tests, limitations, real-telemetry integration, shared-runtime validation
profile-report.mdRaw frame-pacing table (dpr 1 and dpr 2; static, moving, facility, pipeline follow)
Visual acceptance set